

TRADE IDEAS FX-FUTURES-ETF-CRYPTO
TRADE IDEAS FX-FUTURES-ETF-CRYPTO
Hello everyone! The new episode of the "Market Update" is out alongside the new Rationale FX-FUTURES-ETF-CRYPTO report!
New setups
TICKERS: GBPUSD, RSV11!(CME), RSP(ARCA), SOLUSDT
GBPUSD-Long Idea
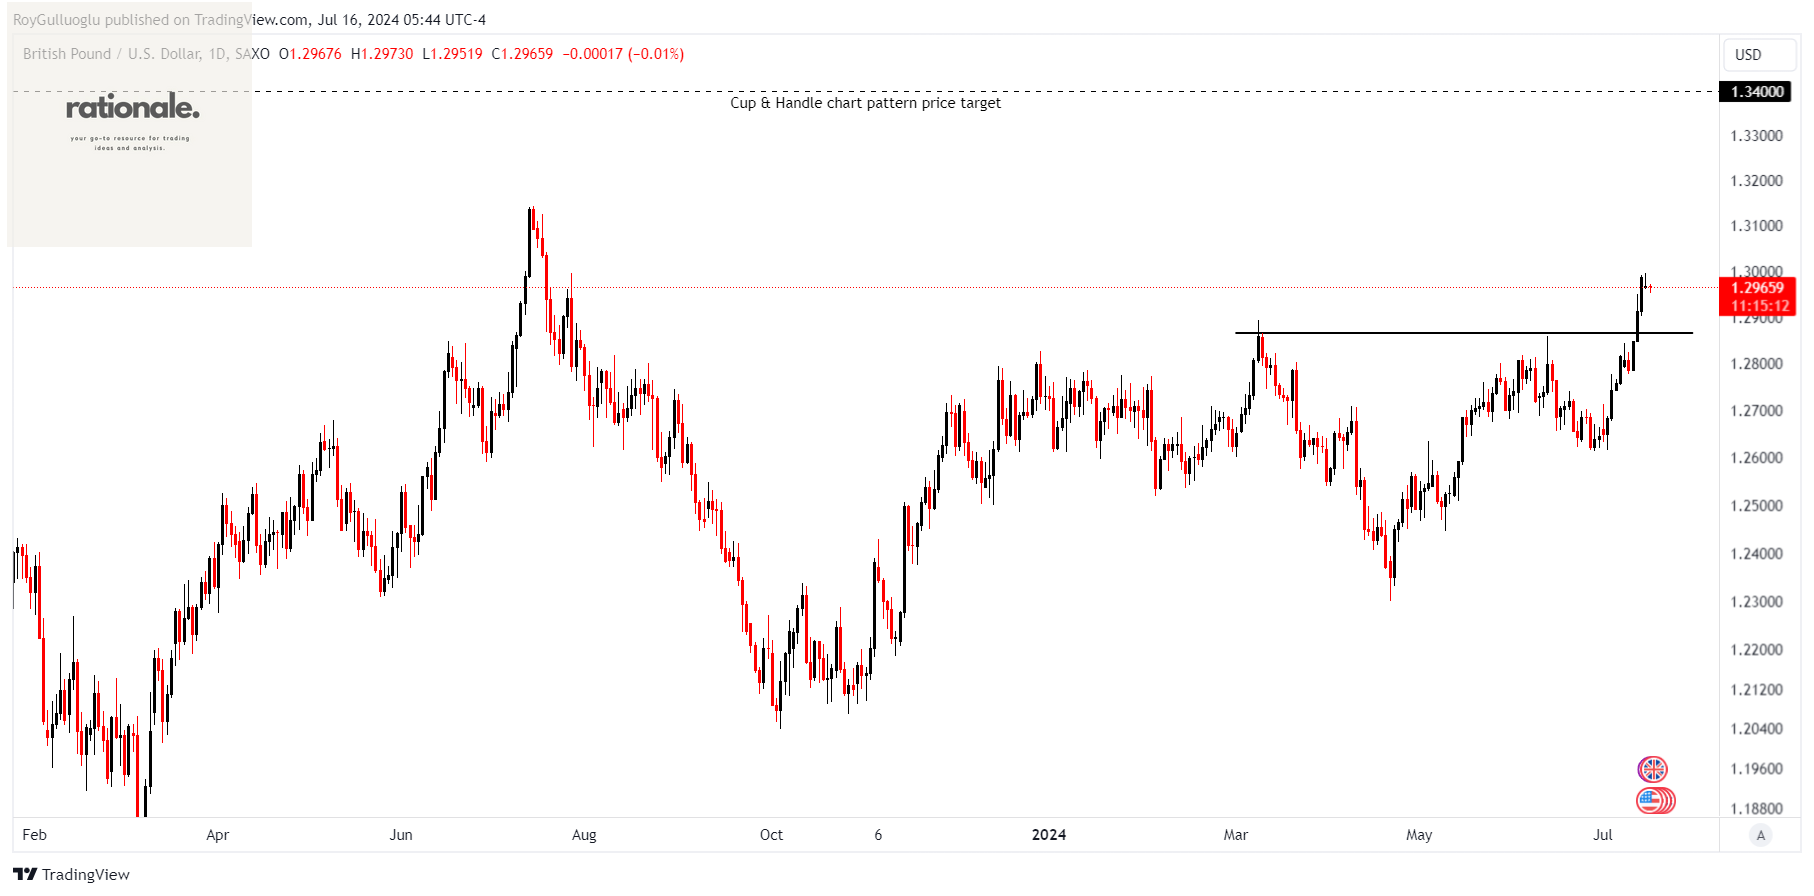
The above daily chart formed an approximately 3-month-long cup & handle chart pattern as a bullish continuation after an uptrend.
Within this pattern, the horizontal boundary at 1.286 levels acts as a resistance.
A daily close above 1.298 levels (%1 high of the resistance for FX, Futures) validated the breakout from the 3-month-long cup & handle chart pattern.
Based on this chart pattern, the potential price target is approximately 1.34 levels.
What could be the drivers of a bullish scenario?
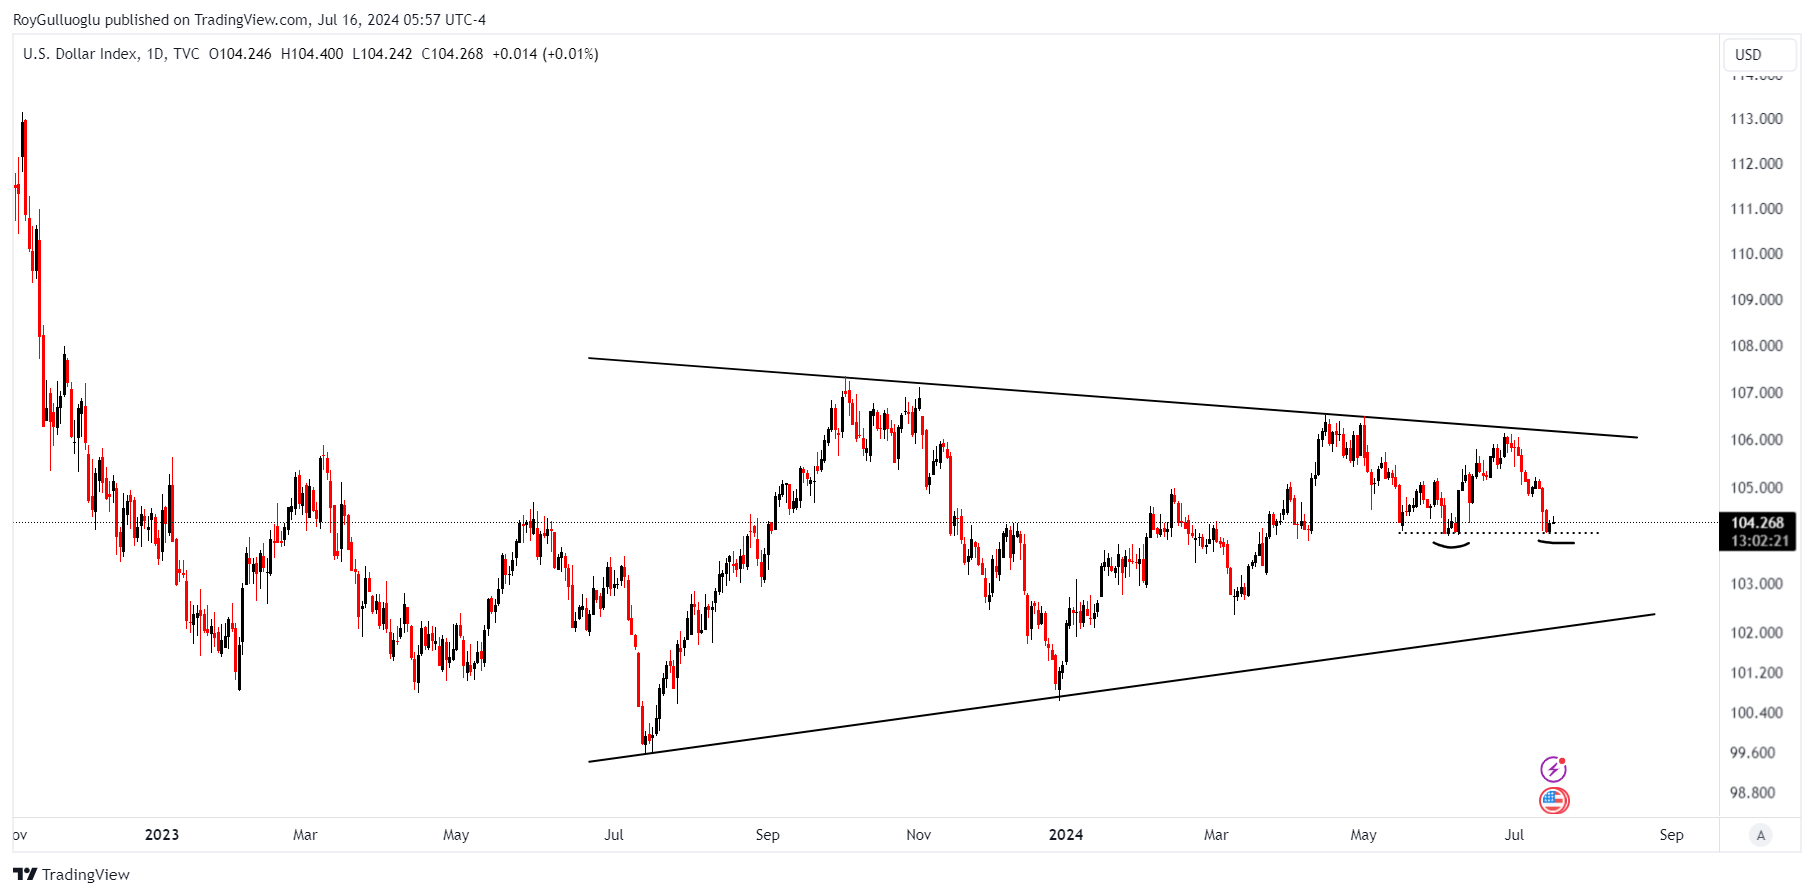
Inflation progress triggers USD drop. The prior low of 104 levels in DXY acts as a support which might lead to a pull back into the GBPUSD chart as well. A pull-back buy is an option.
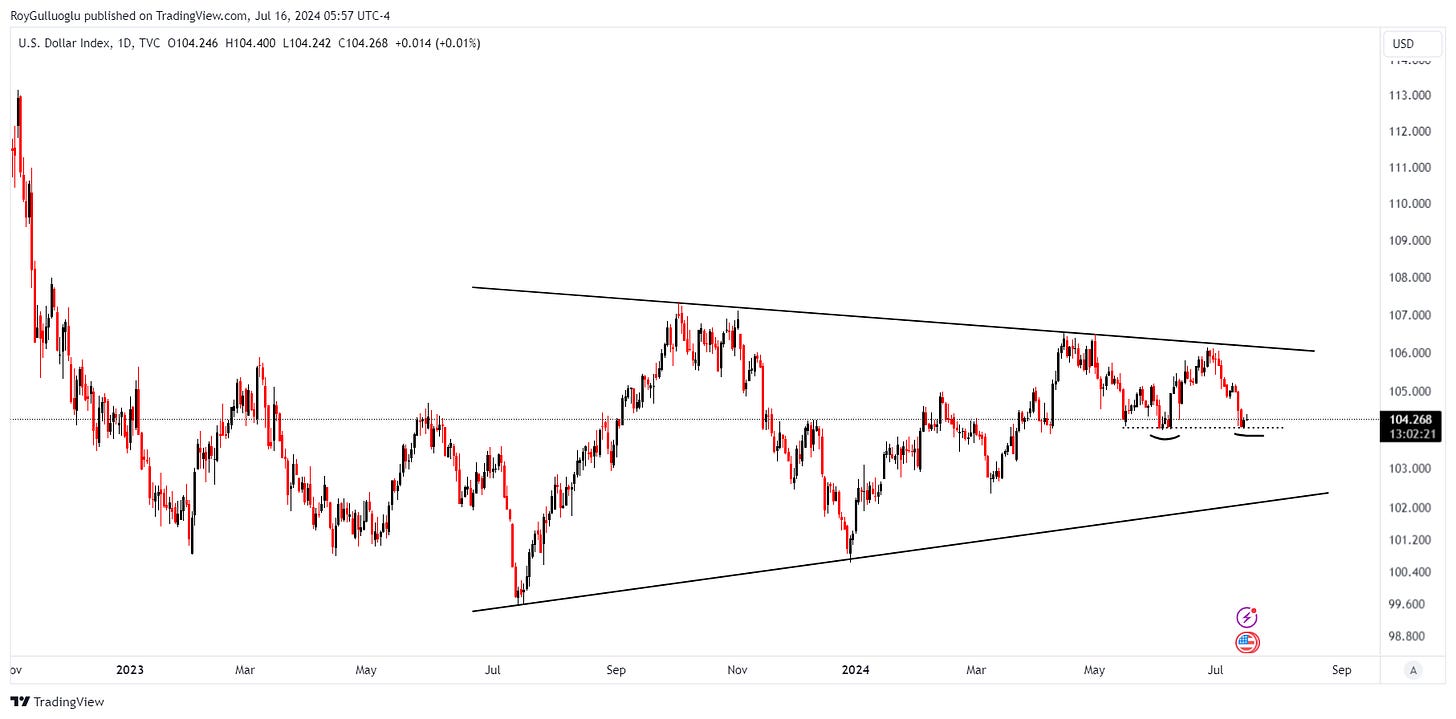
DXY The uncertainty was avoided in the UK after a solid victory of the Labor party. Due to the political risks in the Euro Area and the US, the GBP is a relatively safe haven for now.
RSV1!(E-Mini Russell 1000 Value Index Futures)-Long Idea
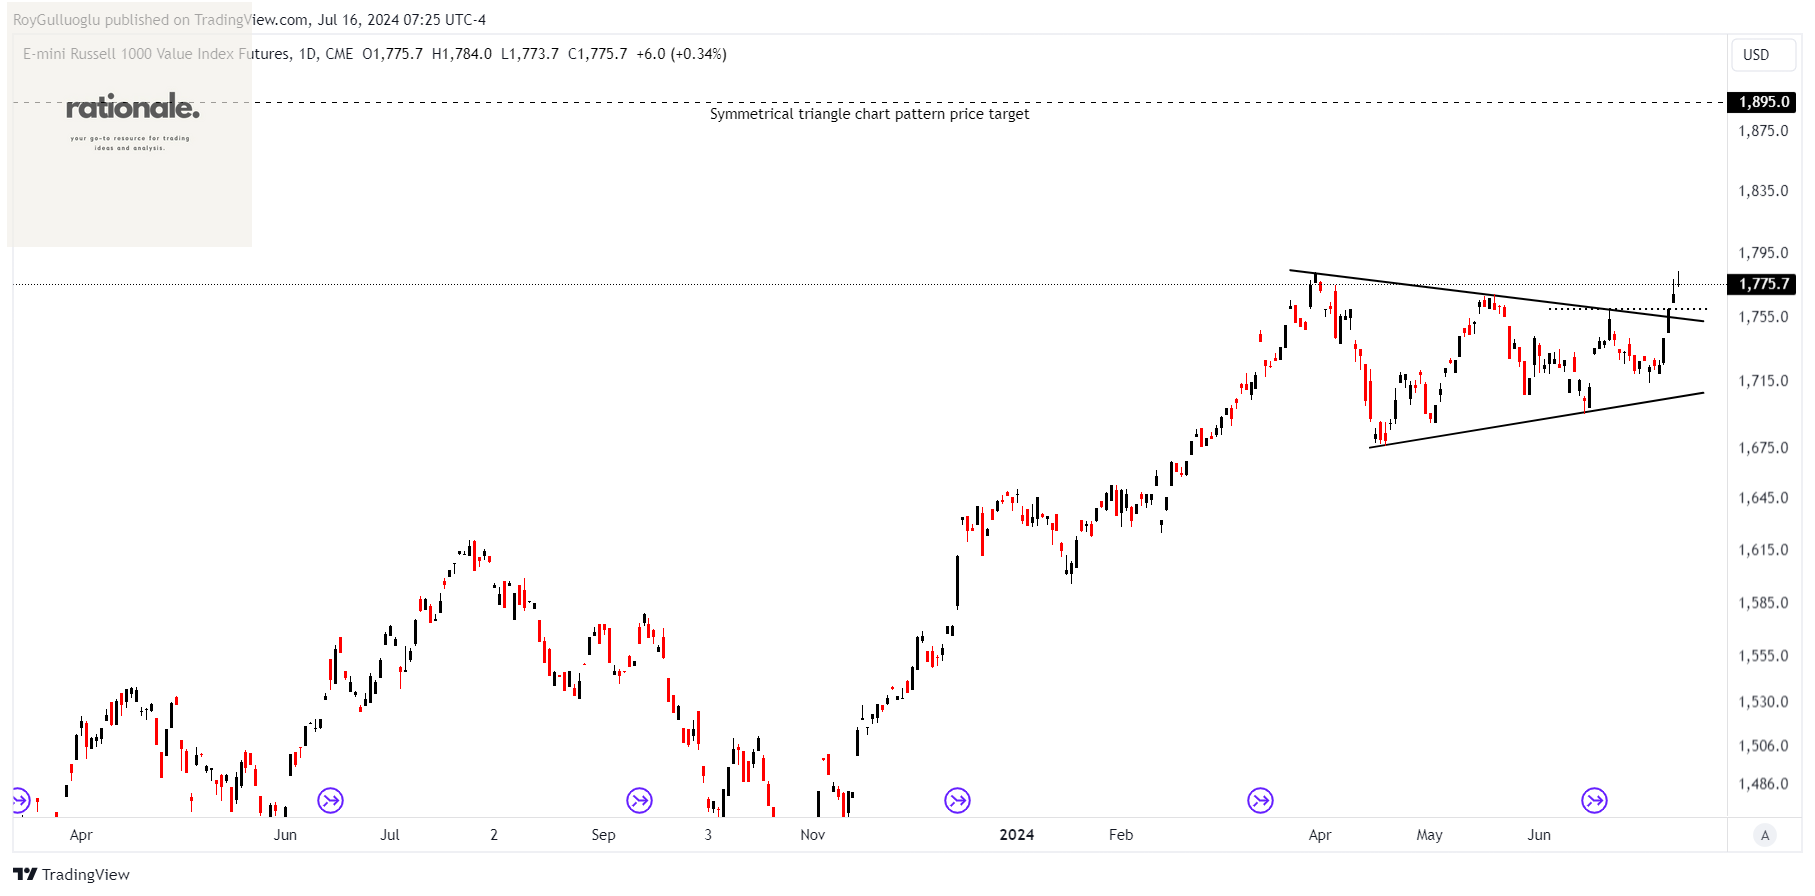
The E-mini Russell 1000 Value Index is a futures contract based on the Russell 1000 Value Index, which is a subset of the broader Russell 1000 Index. The Russell 1000 Value Index includes approximately 1,000 of the largest U.S. companies with lower price-to-book ratios and lower forecasted growth values, representing the value segment of the Russell 1000 Index.
The above daily chart formed an approximately 2-month-long symmetrical triangle chart pattern as a bullish continuation after an uptrend.
Within this pattern, the horizontal boundary at 1760 levels acts as a resistance.
A daily close above 1777(%1 high of the resistance for FX, Futures) levels would validate the breakout from the symmetrical triangle chart pattern.
Based on this chart pattern, the potential price target is 1895 levels.
The trade idea could be used as part of a potential sector rotation trade.
Invesco S&P 500 Equal Weight ETF-(RSP/ARCA)-Long Idea
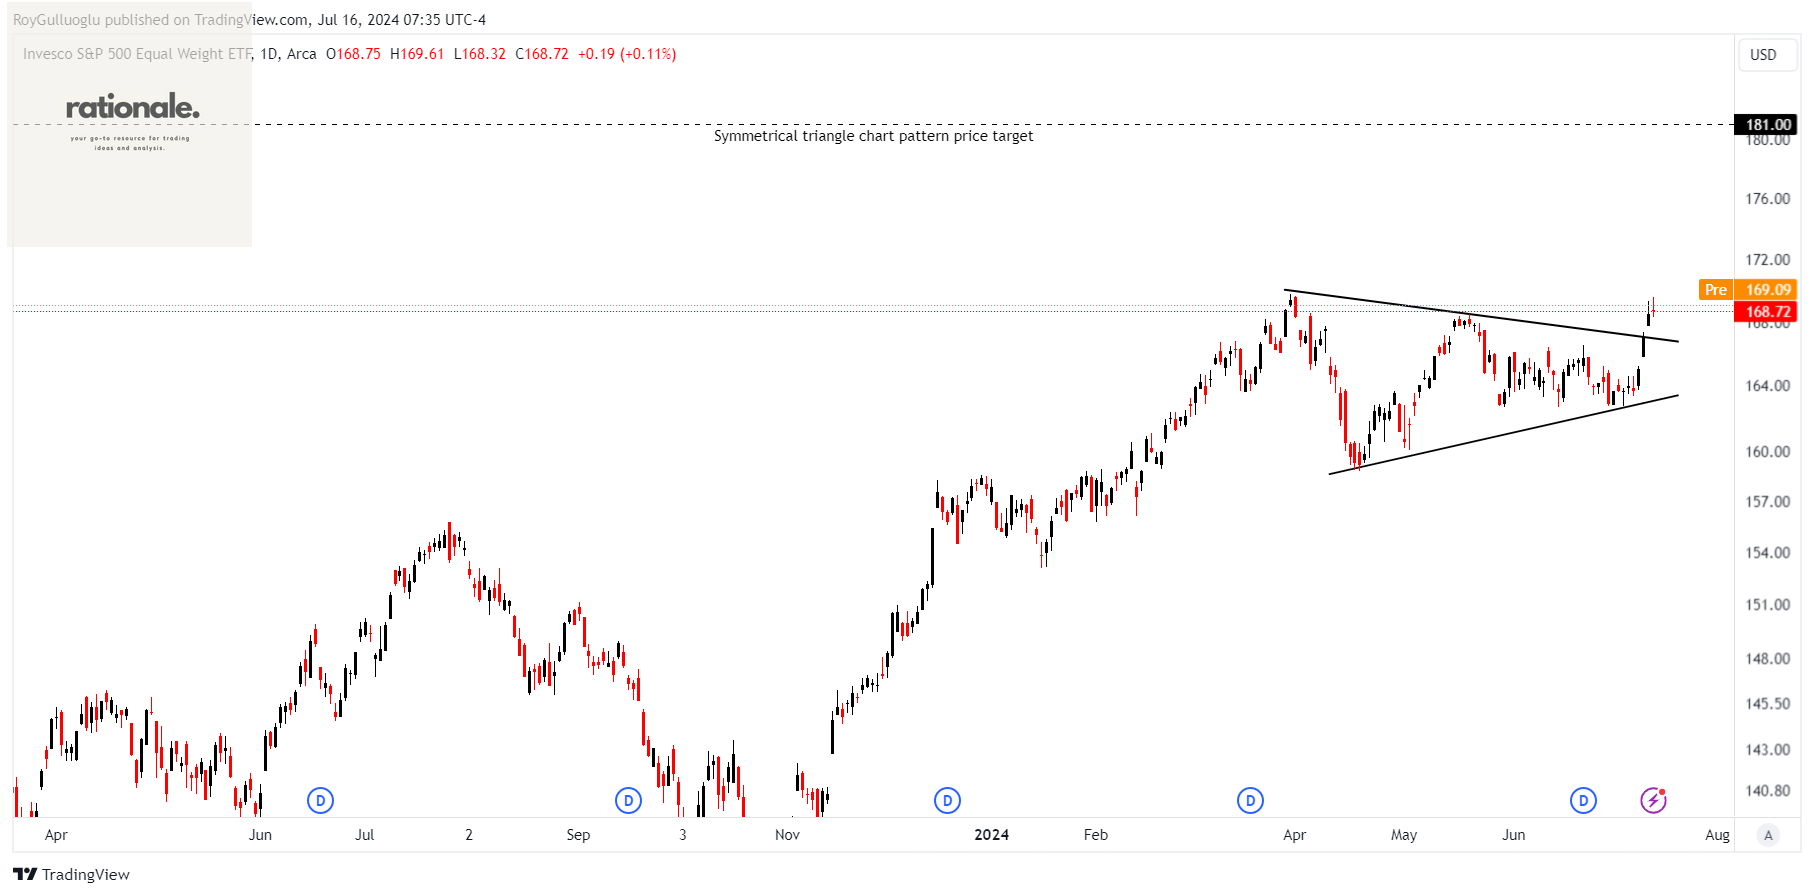
The RSP ETF, or Invesco S&P 500® Equal Weight ETF, tracks the S&P 500® Equal Weight Index, giving equal weight to each of the 500 stocks in the S&P 500 Index. This equal-weight approach results in greater diversification and a more balanced sector representation compared to the traditional market-cap-weighted S&P 500 Index.
The above daily chart formed an approximately 2-month-long symmetrical triangle chart pattern as a bullish continuation after an uptrend.
Within this pattern, 167.38 levels act as a resistance.
A daily close above 169.05 (%1 high of the resistance for FX, Futures, ETFs) levels would validate the breakout from the symmetrical triangle chart pattern.
Based on this chart pattern, the potential price target is 181 levels.
It is another financial instrument that could be used as part of a potential sector rotation trade.
The Industrial Select Sector SPDR Fund-(XLI/ARCA)-Long Idea
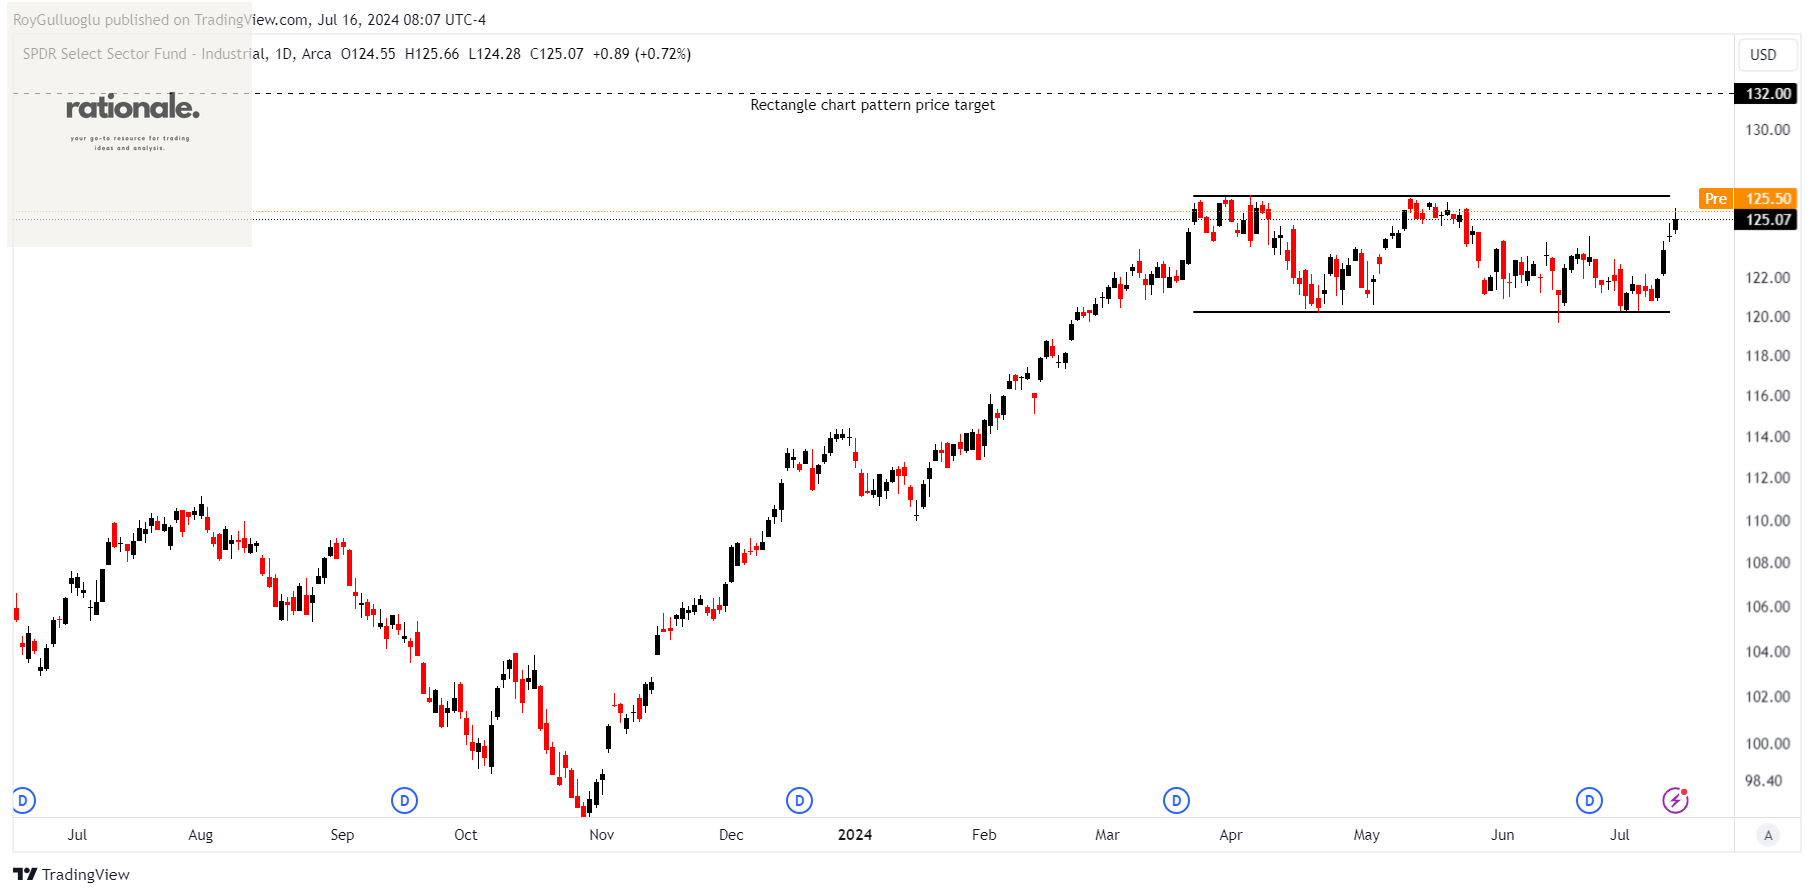
XLI tracks a market cap-weighted index of industrial-sector stocks selected from the S&P 500.
The above daily chart formed an approximately 3-month-long rectangle chart pattern as a bullish continuation after an uptrend.
Within this pattern, the horizontal boundary at 126.34 levels acts as a resistance.
A daily close above 127.6 levels would validate the breakout from the 3-month-long rectangle chart pattern.
Based on this chart pattern, the potential price target is 132 levels.
SOLUSDT - Long Idea
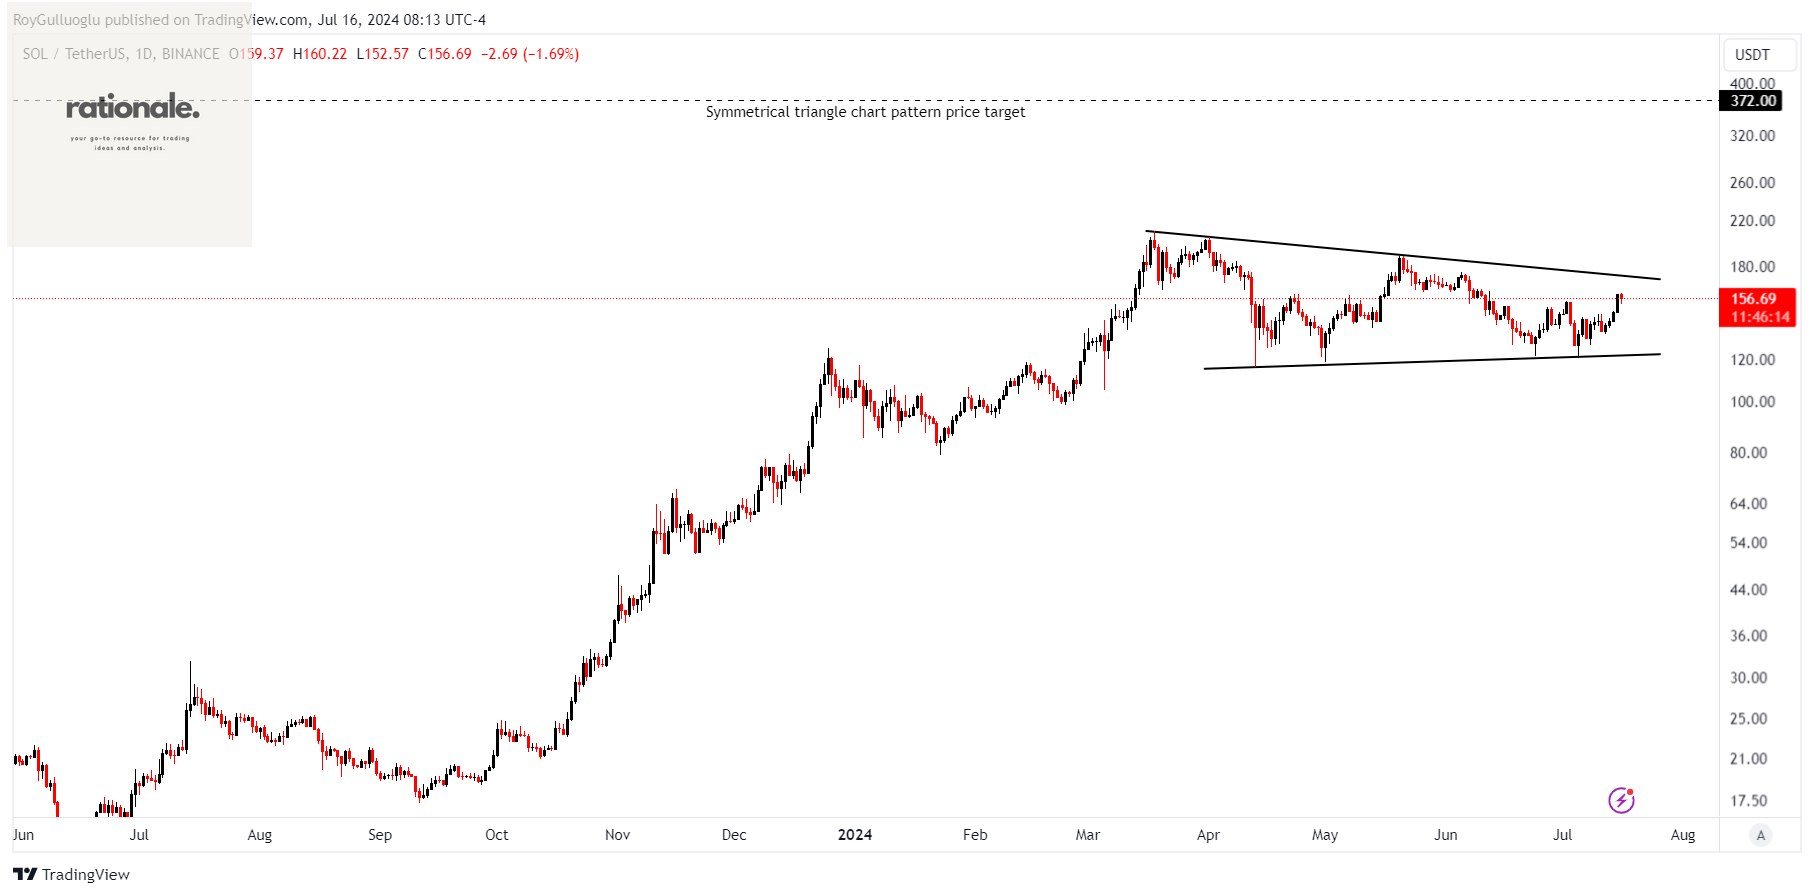
The above daily chart formed an approximately 4-month-long symmetrical triangle chart pattern as a bullish continuation after an uptrend.
Within this pattern, 175 levels act as resistance.
A daily close above 180.25 levels would validate the breakout from the 4-month-long symmetrical triangle chart pattern.
Based on this chart pattern, the potential price target is 372 levels.
Thank you Roy